
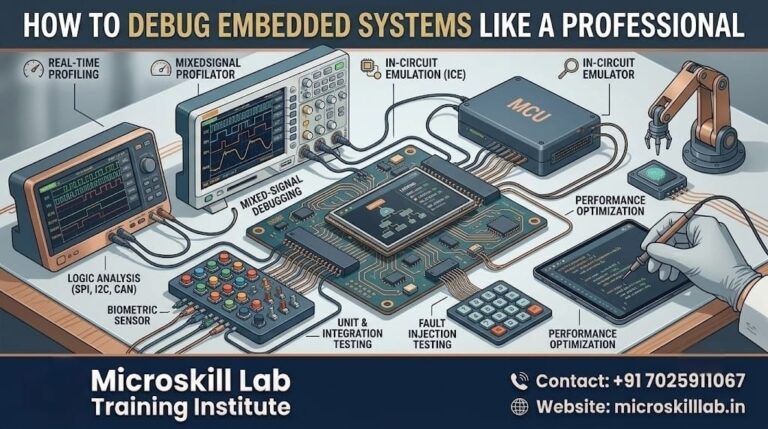
Embedded System Debugging Guide for Professional Developers
Embedded system debugging is the structured process of finding, isolating, and fixing faults in firmware and hardware-software interactions using tools like JTAG, GDB, and logic analyzers. For developers moving from application-level coding to firmware work, mastering embedded system debugging separates hobbyist tinkering from professional-grade engineering. Bangalore’s embedded industry, spread across Electronic City, Whitefield, and Manyata Tech Park, hires heavily for engineers who can debug efficiently under production deadlines.
⚡ Key Takeaways
- Understand the difference between hardware debuggers (JTAG/SWD) and software-only debugging techniques
- Learn a repeatable GDB workflow for setting breakpoints, inspecting registers, and tracing crashes
- Get familiar with ARM Cortex-specific debugging features like fault handlers and the SWO trace port
- Discover which embedded debugging tools Bangalore employers expect entry-level and mid-level engineers to know
- See how live capstone projects at Microskill Lab build real debugging experience before you graduate
- Compare debugging approaches so you can pick the right method for each project stage
What Is Embedded System Debugging?
Embedded system debugging is the practice of identifying why firmware behaves incorrectly on real hardware, where there is no operating system console or easy print statement in many cases. Unlike desktop application debugging, embedded system debugging often means working with limited memory, no display, and hardware that fails silently without an obvious error log. We train developers to treat embedded system debugging as a systematic engineering process rather than trial and error guesswork.
At its core, embedded system debugging combines two disciplines: reading source code the way a compiler does, and reading hardware behaviour the way an oscilloscope does. A developer who only understands software logic will struggle the moment a bug is caused by a voltage dip, a misconfigured clock, or a race condition between two interrupt service routines. That is why we treat embedded system debugging as equal parts firmware knowledge and hardware literacy.
Who Needs This Skill
Embedded system debugging is essential for electronics engineering graduates, embedded software developers, IoT product engineers, and working professionals transitioning from web or app development into firmware roles. Anyone building products on microcontrollers or ARM Cortex processors will eventually need to trace a fault down to a single register or memory address. Even experienced software engineers moving into robotics, automotive, or industrial automation find that their existing debugging habits do not transfer directly to constrained hardware.
Core Debugging Concepts Every Developer Should Know
Before touching any tool, developers should understand concepts like breakpoints, watchpoints, stack unwinding, and memory-mapped registers. Our embedded system debugging curriculum starts here because tool proficiency without conceptual grounding leads to guesswork rather than genuine fault isolation. Students also learn to read datasheets and reference manuals, a skill many self-taught developers skip, and one that becomes critical the moment a chip behaves differently from its documentation.
Why Embedded System Debugging Matters for Developers in Bangalore in 2026
Karnataka’s electronics and IT/ITES sector continues to expand, with product companies and global capability centres hiring embedded engineers who can ship reliable firmware. Embedded system debugging is consistently cited by hiring managers in Bangalore as the single biggest gap between fresh graduates and job-ready candidates. Companies like Bosch, Siemens, and L&T expect new hires to independently trace firmware crashes before their first month ends, and interview panels routinely test candidates on live debugging scenarios rather than theory alone.
Career and Salary Impact in India
Embedded engineers with strong embedded system debugging skills in Bangalore typically earn ₹5–12 LPA at the entry to mid level, with senior firmware engineers who specialize in ARM Cortex debugging and RTOS troubleshooting commanding ₹14–22 LPA. Debugging proficiency is often the deciding factor in interview rounds, since it demonstrates hands-on problem-solving over textbook knowledge. Our Embedded Systems Professional Programme is built around this exact hiring gap, with dedicated debugging labs running alongside core firmware modules.
Industry Demand Signals
Job postings across Bangalore’s product engineering firms increasingly list JTAG, GDB, and oscilloscope-based debugging as mandatory skills, not preferred ones. MeitY-backed electronics manufacturing initiatives are also pushing local companies to build in-house firmware teams, which increases demand for engineers who can perform embedded system debugging independently rather than escalate every issue to a senior architect. Recruiters in Karnataka’s IT/ITES corridor tell us candidates who can demonstrate a debugging session live, using their own laptop and a JTAG probe, consistently outperform candidates with only certificate-based knowledge.
Essential Debugging Tools: JTAG, GDB, and Beyond
Every professional embedded developer needs a working knowledge of hardware debug probes and software debuggers before they can call themselves proficient in embedded system debugging. JTAG and SWD (Serial Wire Debug) give direct access to a microcontroller’s core registers and memory, while GDB provides the command interface most toolchains rely on for source-level debugging.
Hardware Debug Probes
JTAG remains the standard for multi-core and legacy chips, while SWD is common on ARM Cortex-M devices because it uses fewer pins. Tools like ST-Link, J-Link, and Black Magic Probe connect these interfaces to a host machine so developers can set breakpoints directly on silicon, halt execution mid-instruction, and read out register contents without disturbing the running firmware more than necessary.
Software Debugging Tools
GDB, paired with OpenOCD or a vendor-specific server, lets developers step through code, inspect variables, and examine the call stack without modifying the source. We also teach logic analyzers and oscilloscopes for timing-sensitive bugs that a software debugger alone cannot catch, since some faults only appear at signal-level timing that GDB has no visibility into.
Tools and technologies covered in our embedded system debugging labs:
- JTAG and SWD hardware debug probes (ST-Link, J-Link)
- GDB with OpenOCD for ARM Cortex-M targets
- Logic analyzers for protocol-level tracing (I2C, SPI, UART)
- Oscilloscopes for signal-timing and power-glitch analysis
- Serial Wire Output (SWO) for real-time trace logging
- Static analysis tools for catching bugs before flashing hardware
- Vendor IDEs (STM32CubeIDE, MPLAB X) with integrated debug consoles
Debugging ARM Cortex Firmware: A Step-by-Step Workflow
ARM Cortex-M processors dominate the microcontroller market, which is why our programme dedicates significant lab time to Cortex-specific embedded system debugging features. Understanding fault handlers, the Nested Vectored Interrupt Controller, and the SWO trace port gives developers a major edge over engineers who only know generic GDB commands.
Reading Hard Fault Registers
When firmware crashes on a Cortex-M chip, the hard fault handler captures register values that reveal exactly where execution failed. We train students to decode these registers manually, since automated tools are not always available on production hardware in the field, and understanding the raw fault status registers builds intuition that generic error messages never provide.
Students learn to interpret the Configurable Fault Status Register, the Link Register, and the Program Counter at the moment of failure, then trace those values back to the exact line of C code that triggered the fault. This manual decoding skill is what separates engineers who can debug a shipped product in the field from those who can only debug on a development board with a full IDE attached. Many Bangalore employers specifically test this exact skill during technical interviews, often handing candidates a fault dump and asking them to walk through the analysis on the spot.
Using SWO Trace and Breakpoint Strategy
The Serial Wire Output port streams real-time debug data without stopping the processor, which is critical for timing-sensitive applications like motor control or sensor sampling. Our trainers show students how to combine SWO trace logging with strategic breakpoints so they can perform embedded system debugging without disrupting real-time behaviour. Learners apply these techniques directly in our Arduino Programming and Projects course before moving to more advanced ARM Cortex hardware later in the programme.
We also teach students a consistent five-step workflow that applies across both fault-register analysis and SWO tracing: reproduce the fault, isolate the failing module, form a hypothesis, verify it with a breakpoint or trace capture, and confirm the fix under the original conditions. This workflow keeps debugging sessions structured, even under interview pressure or production deadlines, instead of degenerating into random code changes.
Common Embedded Debugging Challenges and How to Solve Them
Firmware bugs are often intermittent, hardware-dependent, or only visible under specific power and timing conditions, making them harder to reproduce than typical software bugs. We walk students through the most common failure categories they will encounter during real embedded system debugging work on the job.
Memory Corruption and Stack Overflows
Limited RAM on microcontrollers means stack overflows and buffer overruns are common, and they frequently manifest as unrelated crashes elsewhere in the code. Students learn to use watchpoints and canary values to catch corruption early rather than chasing symptoms across unrelated modules.
Timing and Race Condition Bugs
Interrupt-driven firmware often hides race conditions that only appear under real-world timing, not in a slowed-down debugger session. We teach non-intrusive tracing methods, including SWO and logic analyzer captures, so students can diagnose these bugs without changing the timing behaviour that caused them in the first place.
This is often called the “Heisenbug” problem, where the act of debugging changes or hides the bug itself. Stopping execution at a breakpoint can mask a race condition entirely, since interrupts that would normally fire during a critical window are delayed until the developer resumes execution. Students practice identifying shared resources that lack proper mutex or critical-section protection, and they learn to add lightweight, non-blocking instrumentation that captures timing data without disturbing the interrupt schedule that caused the original fault.
I2C and SPI communication failures are another frequent source of intermittent bugs, often caused by incorrect clock polarity, missing pull-up resistors, or bus contention between devices sharing the same lines. We dedicate lab time to using logic analyzers to capture and decode these protocols directly, so students can visually confirm whether a fault originates in firmware configuration or in the physical wiring itself, rather than guessing between the two possibilities.
Get hands-on with the same embedded system debugging tools used by Bangalore’s product engineering teams. Our trainers guide you from GDB fundamentals to live ARM Cortex fault analysis on real hardware. Enrol in the Embedded Systems Professional Programme
Curriculum: What You'll Learn at Microskill Lab Training Institute
Our embedded system debugging curriculum is built around live hardware labs rather than simulations, so students graduate with the same skills employers test for in technical interviews. We have trained 500+ learners since 2019 across our embedded and electronics programmes, many of whom now work as firmware engineers across Bangalore’s product companies.
Hands-On Lab Structure
Each debugging module pairs a concept lecture with a lab exercise on real ARM Cortex boards, using the same JTAG probes and GDB workflows used in industry. Students debug intentionally broken firmware images, which mirrors the troubleshooting they will face on the job far more closely than reading textbook examples ever could.
Labs run in small batches so every student gets individual board time rather than watching a projector demo. Trainers introduce faults ranging from simple logic errors to subtle timing and memory-corruption issues, and students are expected to diagnose the root cause using the actual tools covered in lecture, not shortcuts or hints. This mirrors how technical interviews at Bangalore product companies are structured, where candidates are often given a broken board and asked to find the fault live.
Capstone Project and Career Support
Every student completes a capstone project involving a multi-module embedded system with an intentionally introduced fault set, which they must diagnose and fix using the tools covered in class. Our placement support connects graduates with Bangalore hiring partners, and our Embedded Linux Development course is a popular next step for students who want to specialize further into Linux-based debugging with tools like GDB server and strace.
Eligibility criteria for our embedded system debugging track:
- Basic C programming knowledge (college-level or self-taught)
- B.E./B.Tech in Electronics, Electrical, or Computer Science (or equivalent experience)
- Working professionals with prior microcontroller exposure are also welcome
- No prior JTAG or GDB experience required; we start from fundamentals
How to Choose the Right Embedded Debugging Training in Bangalore
Not every training programme gives students real access to hardware debug probes, which is a critical gap since embedded system debugging skills only develop through hands-on practice. When evaluating institutes, ask specifically how many hours are spent on live hardware versus simulation.
Questions to Ask Before Enrolling
Ask whether the programme covers ARM Cortex fault handling specifically, since many generic courses stop at basic breakpoint usage and never touch real embedded system debugging scenarios. Also confirm batch sizes, since debugging instruction benefits from small groups where trainers can review each student’s board individually rather than lecturing to a large hall.
Why Developers Choose Microskill Lab
Our trainers bring real product-engineering experience, and our labs are structured around the exact embedded system debugging tools Bangalore employers list in job postings. Students also get access to our PIC Microcontroller Programming course and PCB Designing course if they want to broaden their hardware skill set alongside debugging, and our Electronics Fundamentals course is available for students who need to build core circuit knowledge first.
Debugging Approaches Compared
| Approach | Best For | Limitation |
|---|---|---|
| Print/UART debugging | Quick checks, low-cost setups | Slows timing-sensitive code, limited insight |
| JTAG/SWD + GDB | Source-level embedded system debugging, register inspection | Requires a hardware probe and toolchain setup |
| Logic analyzer / oscilloscope | Protocol and timing-level faults | Does not show source-code context directly |
| SWO trace | Real-time, non-intrusive logging | Needs Cortex-M hardware support |
Frequently Asked Questions
What is the difference between JTAG and SWD?
JTAG uses more pins and supports multi-core or boundary-scan testing, while SWD uses just two pins and is the standard debug interface on most ARM Cortex-M microcontrollers used in modern embedded system debugging workflows.
Do I need to know GDB to get an embedded engineering job in Bangalore?
Most embedded roles in Bangalore expect at least basic GDB proficiency, since it remains the standard debugger across major toolchains including ARM GCC and many vendor IDEs used for embedded system debugging.
Can I learn embedded system debugging without an electronics background?
Yes. Computer science graduates and working professionals with C programming knowledge can learn embedded system debugging; our programme starts with fundamentals before moving to hardware-specific tools.
How long does it take to become job-ready in embedded system debugging?
Most students reach a job-ready debugging skill level within 8–12 weeks of consistent lab practice, depending on prior programming experience and how much time they can dedicate to hands-on hardware sessions each week.
What career roles use embedded system debugging skills?
Firmware engineer, embedded software developer, IoT product engineer, test and validation engineer, and hardware-software integration engineer all rely heavily on debugging skills as part of their daily work.
Ready to build real embedded system debugging expertise on ARM Cortex hardware? Talk to our team about our next embedded systems batch in Bangalore.